Official C-10 Blog

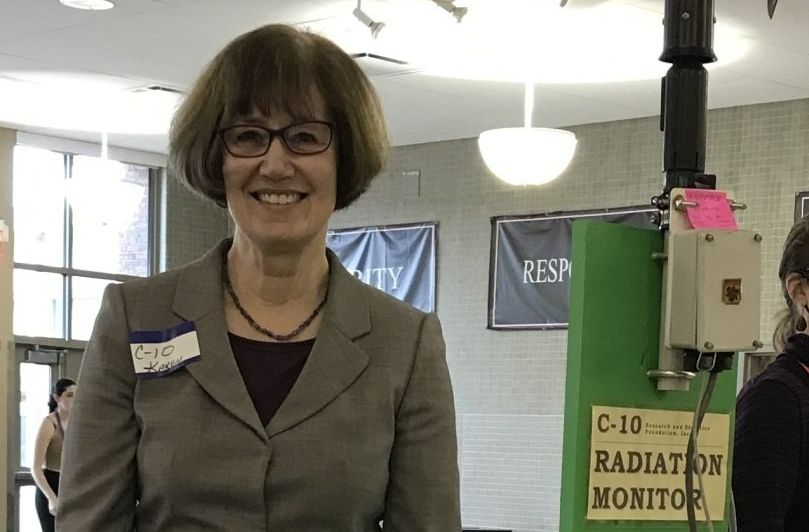
C-10 is on board with the data revolution! For over 30 years our Citizens Radiation Monitoring Network (CRMN) has been collecting data on the airborne radiation levels in the 10-mile Emergency Planning Zone (EPZ) radius around the Seabrook Nuclear power plant.
Since 2010, all that data has been digital, empowering us to make our data usable for not just our own research, but also potentially useful in the areas of health-impact studies, regulatory compliance, radiation physics, and more!
The C-10 CRMN measures and records the following at each of our 19 stations, for every minute of every day:
- Wind speed & direction using an anemometer
- Beta radiation levels using a radiation probe
- Gamma radiation levels using a radiation probe
That’s over 1,440 data points each totaling 4,320 data points per station per day, meaning we record over 80,000 data points across the whole network every day!
You might be thinking, whoa, that’s a lot of data, and you’re right. Ever try to load an Excel Spreadsheet with more than a few hundred rows? Then you know that trying to analyze a large set of data in a simple software application is impossible, unless you perhaps have IBM’s artificial intelligence supercomputer Watson.
For the scientists and data enthusiasts out there:
Our process for analyzing and reporting our monitor data is very time-intensive, requiring mass downloading of the log files for the month, loading them into Matlab, and producing the series of charts and analyses which are printed to a PDF format for easy transmission and readability by the Massachusetts Department of Health and other key investigators.
For the layperson: A PDF is a nice “at a glance” review, but is not user friendly for in-depth analysis and research. Understanding the untapped benefits of being able to look at large amounts of our historical data for public health, transparency, and scientific research, we embarked on a journey to find people with the right skills to help us.

